Portfolio Fee Drag Report
Turns a list of fund holdings and their expense ratios into a dollar figure for what you're paying in fees, what a comparable index lineup would cost instead, and what that gap is worth in 10 and 20…

Portfolio Fee Drag Report
Turns a list of fund holdings and their expense ratios into a dollar figure for what you're paying in fees, what a comparable index lineup would cost instead, and what that gap is worth in 10 and 20 years.
Date: 2026-08-18 Type: Report Theme: Investing Status: Idea
What it is
A rendered report built from a portfolio's fund holdings (balance, category, and expense ratio for each one) that computes three things a brokerage statement never shows directly: the total dollar cost of the fees this year, what the same market exposure would cost in comparable low-cost index funds, and what that gap turns into after a decade or two of compounding.
Who it serves
Someone who has money in a handful of actively managed funds across a 401(k), an IRA, and a taxable account, and has never sat down to add up what the expense ratios actually cost in dollars. Most people can tell you their account balance. Few can tell you their weighted-average fee, and fewer still have run the number forward 20 years.
The money problem it addresses
An expense ratio is deducted from a fund's daily value, not billed as a line item, so it's easy to hold a fund for years without noticing what it costs. A 0.9% fund and a 0.05% index fund tracking the same index look identical on a statement, same ticker format, same balance line, until you multiply the percentage by the balance. This report does that multiplication across every holding, flags which ones are furthest from a low-cost equivalent, and runs the fee gap through the same compounding math the Department of Labor uses in its own 401(k) fee guidance, so "0.6% doesn't sound like much" turns into an actual number.
How it works
The data layer supplies one JSON object with a holdings list (fund name, account, category, balance, expense ratio) plus a matching low-cost-alternative expense ratio per category and two benchmark figures (the national average expense ratio for active funds and for passive funds, sourced from Morningstar's annual fund fee study). The template renders that into: a holdings table with per-fund annual fee cost, an ASCII bar chart ranking holdings by fee dollars, a category-by-category comparison against a low-cost index alternative, a 10-year and 20-year compounding projection using the DOL's future-value method, and a short comparison of the reader's actual fees against the national active/passive averages.
What's in this folder
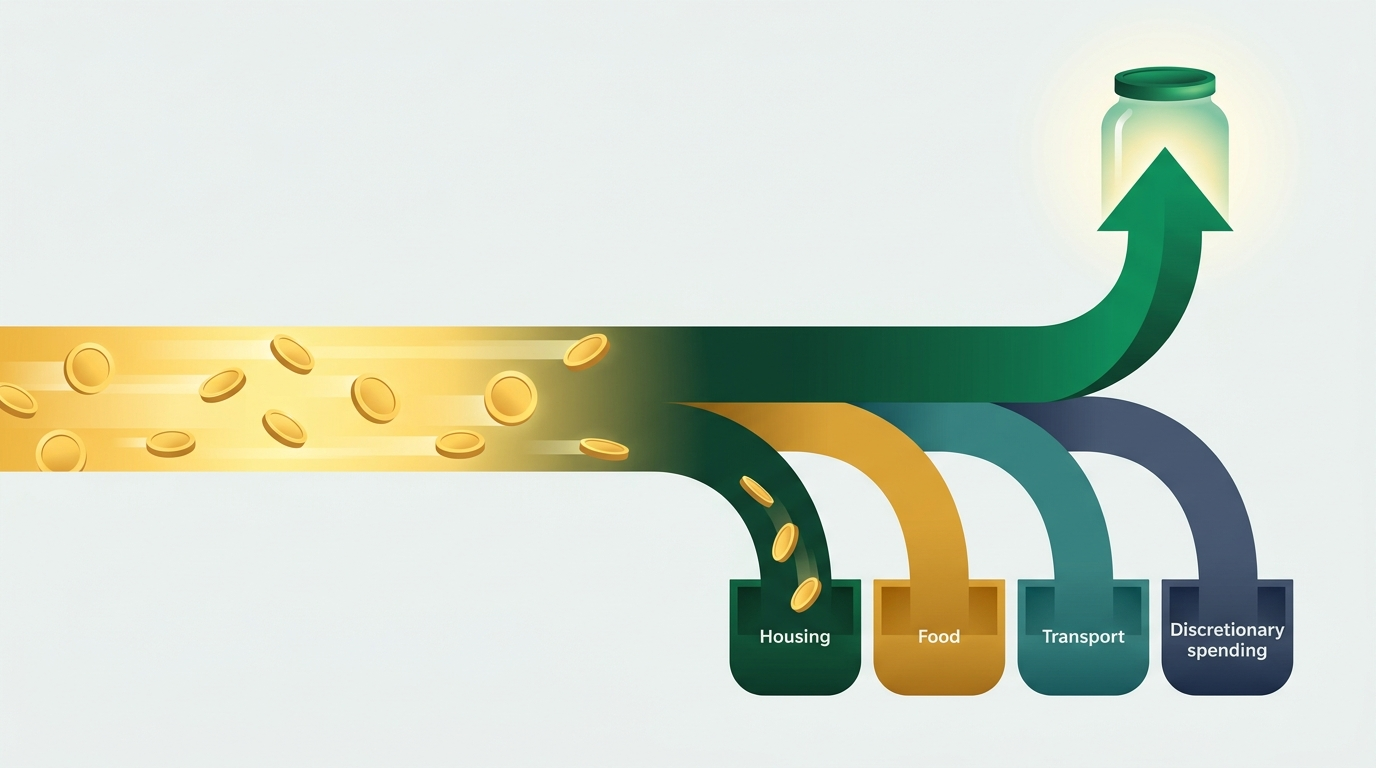
report.md— the fully rendered report for a synthetic investor ("Marcus T.") with seven holdings across a taxable brokerage, a Roth IRA, and a 401(k).report-template.md— the same report with every value replaced by a{{placeholder}}, including the{{#each}}loops over the holdings and category-comparison lists.sample-data.json— the synthetic dataset behindreport.md: seven holdings with balances (in cents) and expense ratios (in basis points), the low-cost alternative for each category, and the benchmark figures the report cites.cover-image.png— cover art for this idea card.metadata.md— generation metadata for this run.
How to run / read it
Open report.md for the rendered version. See report-template.md for the placeholders a real data pipeline would fill in, and sample-data.json for the exact shape of the source data: balances as integer cents and expense ratios as integer basis points, so nothing gets rounded through a float along the way. To adapt this for a real portfolio, export your holdings (most brokerages show expense ratio on the fund detail page) into the same JSON shape.
Estimated impact
On the sample portfolio ($173,500 across seven holdings), swapping each active fund for a comparable index fund in the same category cuts the annual fee bill from $1,009.56 to $93.62, about $916 a year back, or roughly $62,700 less lost to fees over 20 years at a 7% assumed return with no further contributions (see report.md for the full projection and its stated assumptions). The exact savings depend entirely on the reader's actual holdings; a portfolio already in low-cost index funds would show close to nothing here, which is itself a useful result.
Good to know
This is a fee-comparison and arithmetic tool, not personalized investment advice, and it doesn't recommend any specific fund, ticker, or provider. It compares category-level pricing (active vs. index) using publicly reported averages. A workplace 401(k) is usually limited to whatever fund menu the plan offers, so "swap to an index fund" may not be a one-click move there the way it is in a taxable brokerage or IRA. Expense ratios and industry averages change year to year; check the fund's current prospectus or fact sheet before treating any number here as current.
Sources
https://www.dol.gov/sites/dolgov/files/ebsa/about-ebsa/our-activities/resource-center/publications/401k-plan-fees.pdf— DOL's worked fee-drag example (7% return, 35 years, 1-point fee difference = 28% lower ending balance), the method this report's projection mirrors.https://www.morningstar.com/business/insights/blog/funds/us-fund-fee-study— Morningstar's 2026 U.S. Fund Fee Study: 2025 asset-weighted average expense ratios (0.58% active U.S. equity funds, ~0.10% passive funds).https://www.ici.org/news-release/mutual-fund-and-etf-fees-remained-near-historic-lows-in-2025— 2025 average expense ratios for index equity (0.40%) and index bond (0.36%) mutual funds.https://www.forbes.com/sites/investor-hub/article/charles-schwab-vs-fidelity-vs-vanguard-total-stock-market-funds/— current total-market index fund expense ratios (Fidelity 0.015%, Vanguard 0.03%, Schwab 0.03%).https://financer.com/invest/what-is-the-expense-ratio-of-mutual-fund/— plain-language definition of how an expense ratio is charged.
More from Financial Ideas