Climate & Weather Events — 2002
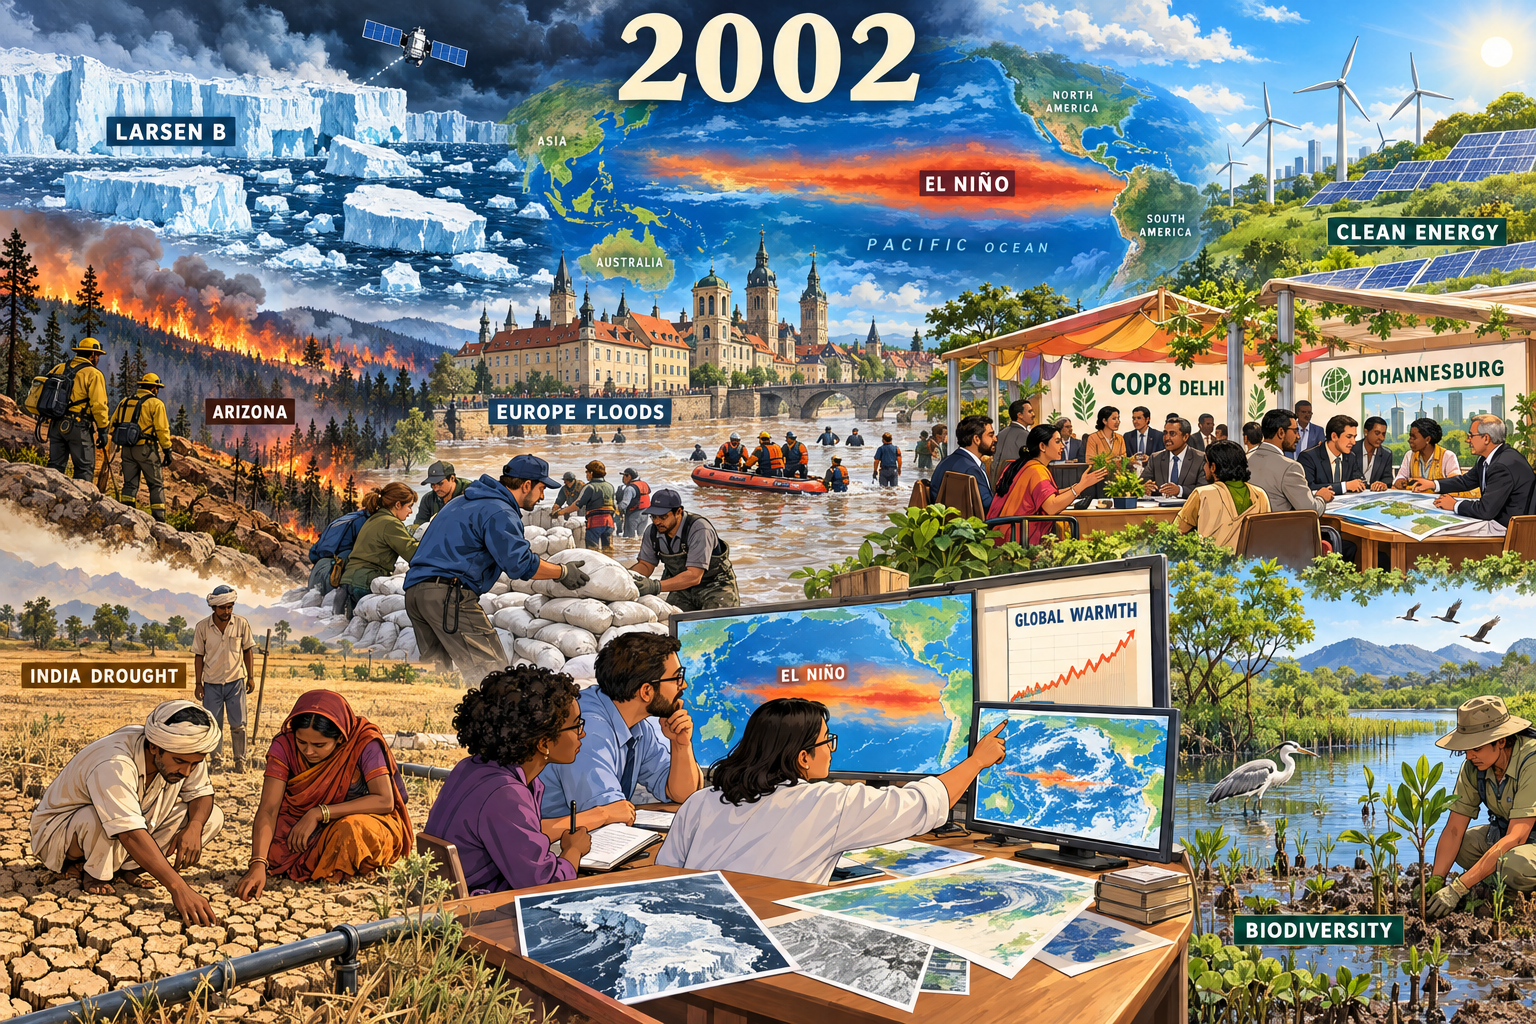
Larsen B ice-shelf collapse (February–March). A defining polar-change observation; fragmented shelf ice and a generic satellite connect the event to monitoring.
Climate & Weather Events: 2002
- Year: 2002
- Model: built-in gpt-image
- Generation date: 2026-10-13 (UTC)
- Saved image:
My-Library/Images/Collections/Climate-Weather-Events/Images/Climate-Weather-Events_2002.png
Selected moments, reasons and sources
- Larsen B ice-shelf collapse (February–March). A defining polar-change observation; fragmented shelf ice and a generic satellite connect the event to monitoring. Source: https://science.nasa.gov/earth/earth-observatory/larsen-b-ice-shelf-collapse-2351/
- August central European floods. A major extreme-weather event; historic riverside buildings, sandbags and a rescue boat emphasize response. Source: https://ntrs.nasa.gov/citations/20030020912
- Arizona Rodeo-Chediski fire (June). A defining wildfire landscape; distant fire, burn scar and calm firefighters avoid sensationalism. Source: https://science.nasa.gov/earth/earth-observatory/rodeo-and-chediski-fires-in-arizona-9804/
- India's drought monsoon. Expands the page beyond Europe and North America; farmers inspect dry soil and an irrigation pipe. Source: https://esdpubs.nasa.gov/content/Influence_of_anomalous_dry_conditions_on_aerosols_over_India_Transport_distribution_and
- Development of the 2002–03 El Niño. Important climate-system context; a schematic Pacific map shows warm water west of South America. It does not imply that every disaster shown was caused by El Niño. Source: https://www.cpc.ncep.noaa.gov/products/analysis_monitoring/enso_disc_nov2002/
- High global temperatures. Scientists study a schematic chart. NASA's contemporary report ranked the 2002 meteorological year second warmest in its instrumental series at the time; this is not its current rank. No temperature number or precise dataset is fabricated in the illustration. Source: https://data.giss.nasa.gov/gistemp/news/2002/
- COP8 Delhi Ministerial Declaration. Climate policy and sustainable development enter the scene through a generic delegate pavilion. Source: https://www.unfccc.int/process-and-meetings/conferences/past-conferences/new-delhi-climate-change-conference-october-2002/decisions-new-delhi-climate-change-conference-october-2002
- Johannesburg World Summit on Sustainable Development (August–September). Its declaration and implementation plan provide the year's broader environmental-policy context, represented by a second open planning pavilion. Source: https://www.un.org/en/conferences/environment/johannesburg2002
- Johannesburg renewable-energy diversification agenda. Solar panels and wind turbines illustrate the summit's call to diversify energy and add renewable sources; this is an agenda illustration, not a claim that these pictured projects were built in 2002. Source: https://www.un.org/en/conferences/environment/johannesburg2002
- Johannesburg biodiversity commitments. Wetland habitat, birds and planting show the conservation agenda. Again, this illustrates policy goals rather than a specific completed restoration project. Source: https://www.un.org/en/conferences/environment/johannesburg2002
Balance and tone
Four hazard moments are balanced by climate-system research, temperature monitoring, two policy gatherings, renewable-energy goals and biodiversity goals. Sandbagging, rescue and planting carry recovery throughout. No disaster casualty, damage or acreage totals are asserted. Maps, charts and geographically compressed scenery are illustrative, not measured reconstructions. The European architecture is an invented composite, not a claim about one flooded street. Studies published after 2002 are used only to verify the year's drought, not presented as discoveries announced in 2002.
Readable labels
2002; LARSEN B; ARIZONA; EUROPE FLOODS; INDIA DROUGHT; EL NIÑO; PACIFIC OCEAN; ASIA; AUSTRALIA; NORTH AMERICA; SOUTH AMERICA; GLOBAL WARMTH; COP8 DELHI; JOHANNESBURG; CLEAN ENERGY; BIODIVERSITY.
Final prompt used
Use case: illustration-story. Create a respectful environmental-editorial retrospective for 2002, wide 3:2 landscape, one unified continuous landscape flowing from hazards at left to science and recovery at right, not a rigid grid or sticker collage. Match Climate & Weather Events 2000 and 2001: polished cartoon-editorial science-magazine illustration, clean confident linework, dimensional painterly digital detail, expressive generic responders and scientists, geography woven into maps and landscape, large readable ivory year heading "2002" at top center. Storm slate blues, heat oranges, smoke amber, floodwater browns and drought ochres balanced by conservation greens and clear sky blues. Combine TEN selected moments: Antarctic Larsen B ice-shelf breakup shown as fragmented floating ice under a small research satellite, with label "LARSEN B"; central European August floods with recognizable generic historic riverside buildings, river water, sandbag volunteers and rescue boat, label "EUROPE FLOODS"; Arizona Rodeo-Chediski wildfire shown as a distant forest burn scar and calm firefighters on a safe line, label "ARIZONA"; Indian monsoon drought depicted by farmers checking a cracked field and irrigation pipe, label "INDIA DROUGHT"; return of El Niño as a warm equatorial Pacific band on the large background world weather map, label "EL NIÑO"; the year's historically high global temperature as a scientist's modest chart labeled "GLOBAL WARMTH", no invented numeric scale or modern ranking; COP8 Delhi declaration as diverse generic delegates under a small sign "COP8 DELHI"; Johannesburg sustainable-development summit as a nearby planning table labeled "JOHANNESBURG"; the summit's renewable-energy diversification agenda as wind turbines and solar panels on a green ridge, label "CLEAN ENERGY"; the summit's biodiversity protection commitments as wetland habitat, bird, seedlings and conservation fieldworker, label "BIODIVERSITY". The renewable and conservation scenes illustrate 2002 policy aims, not claimed completed projects. Foreground response and science are central: volunteers stack sandbags, researchers compare maps on a desk, farmers inspect soil, conservation workers plant saplings. Largest anchors are Larsen B, European flooding and international science/policy; connect all areas through the shared world map, rivers, ridgelines and atmospheric depth. Serious but hopeful light, dramatic weather on left resolving into daylight over recovery and renewables on right. Short high-contrast labels integrated onto maps, charts, signs and instruments; all correctly spelled, no fake paragraphs, tiny decorative text or bottom caption strip. No gore, bodies, injuries, panic, screaming, disaster spectacle, official agency seals, exact logos, real-person likenesses, watermarks, signatures or borders. CRITICAL GEOGRAPHIC CORRECTION: Do not overlay an El Niño heat band on a world map. Instead show a small geographically clear PACIFIC OCEAN map behind the scientists: eastern Asia and Australia at left edge, North and South America's WEST COAST at right edge, wide Pacific water between them. A narrow red-orange equatorial warm-water band lies entirely in the PACIFIC west of Peru and Ecuador, below Central America. Place "EL NIÑO" within that Pacific water, never in the Atlantic or on land. No other world-map temperature overlay. CRITICAL MEDIUM: illustrated faces with simplified drawn features, visible dark contour lines and soft cel shading; nobody looks like a photographic portrait. Rich painterly editorial cartoon, matching the 2001 sibling's outlined scientists. Integrate policy gatherings into open pavilions in the shared landscape, not rectangular separate panels. Keep all labels readable.
QA
Viewed the saved 1536×1024 PNG against 2000 and 2001. Passed: readable year and place labels; balanced hazards, science, policy, renewables and conservation; prominent shelf breakup, European flooding and science/policy; calm responders and generic illustrated people; no gore, injuries, panic, real-person likenesses or recognizable official logos/seals. Open pavilions and shared landscape replace isolated rectangular policy panels. The first render was rejected for an El Niño band across the wrong ocean and excessively photographic people; one regeneration corrected it to a Pacific-centered schematic and visible cartoon outlines. The final El Niño band remains schematic and broad, not a calibrated SST map. Its main label is accented correctly; a smaller monitor uses unaccented EL NINO. Generic decorative globe/leaf icons in policy signage are not agency seals. No watermark or border. Built-in output persisted at its reported path and was copied directly; no recovery or Gemini fallback required.
More from Image Collections